
Instagram Analytics (Instagram Insights) is an essential tool for creating a successful social media strategy.
Without Instagram Analytics how will you know what works and what doesn’t? Which posts do people like the most? What is the most popular time of day for your posts to be viewed? How many followers do you have? Are you reaching the right people?
In this post I will show you how to get your Instagram Analytics (Insights) and explain what they mean. Instagram provides metrics and insights that you can use to calculate other useful metrics or use the ones provided to analyze and improve your social media strategy.
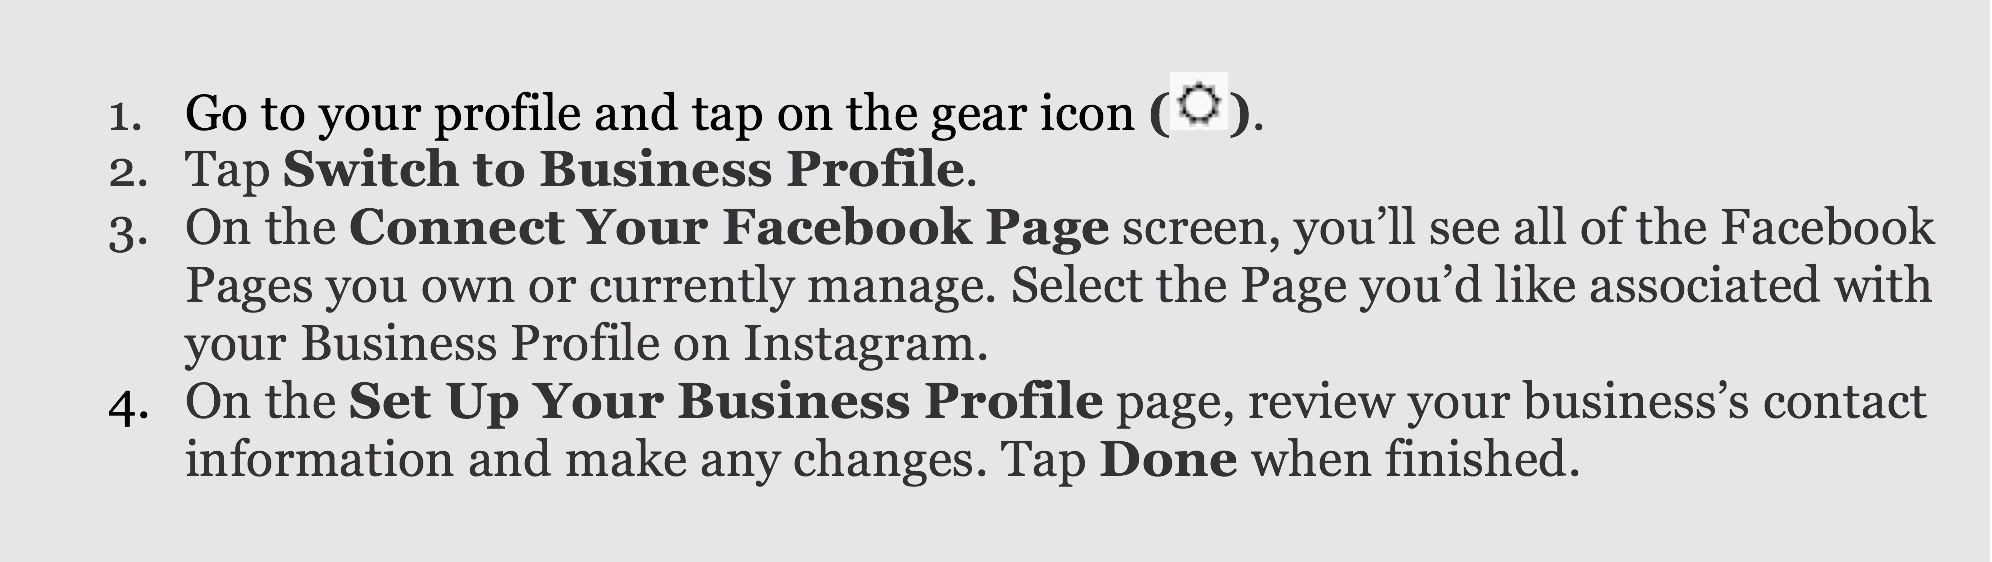
First, in order to access Instagram Analytics (Insights) you will need a Business Profile if you don’t already have one.
To convert your account to a Business Profile use the following instructions (from Facebook):
In order to view ALL of your Instagram Insights you will need at least 100 Followers.
Some Analytics can be visible before reaching 100 Followers. This is limited to
- Posts
- Followers
- Following
- Impressions
- Reach
- Profile Views
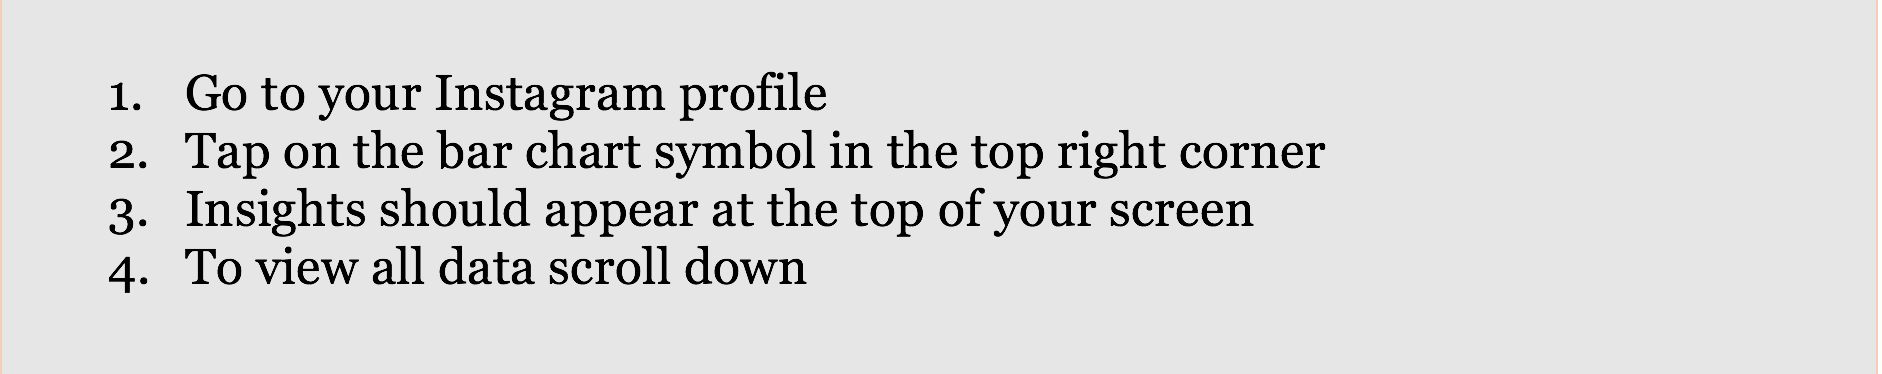
Once you have over 100 Followers on your Business Profile follow these instructions to view your analytics:
Instagram Analytics and Insights – What do they mean?
Profile Data:
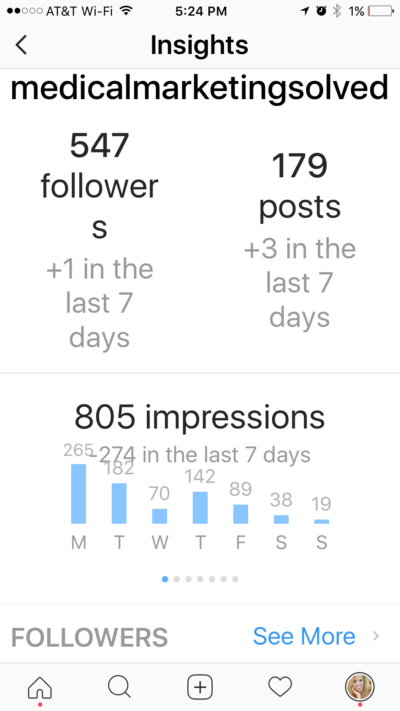
Number of Followers: The number of people who follow your account (in the example below there are 547 followers +1 in the last 7 days)
Number of Posts: The total number of posts in your account (179 posts total +3 in the last 7 days)
Following: The number of people you are following
Number of Impressions: – The total number of times your posts have been seen (in the example below there were 805 impressions over the last 7 days)
From the Impressions section scroll Left for more data:
Reach: The number of unique accounts that saw your posts
Profile Views: Number of times your profile was clicked on
Website Clicks: The number of times people tapped on your website link
Email: The number of times people tap your email address
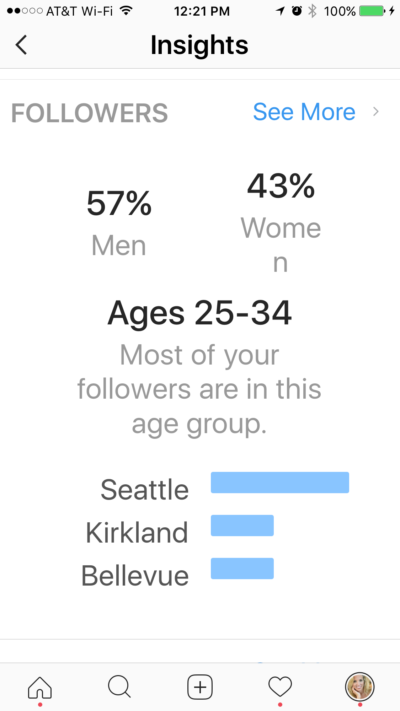
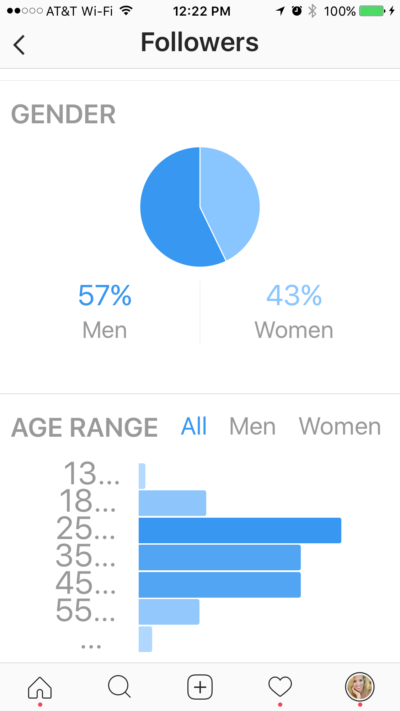
Demographics (Gender, Age, Location)
Gender: % of Women & % of Men
Age: The age distribution of your followers by segment (and by Men and Women)
13-17, 18-24, 25-34- 35-44, 45-54, 55-64, 65+
Location: The top 5 (Cities or Countries) where your followers are
Followers – Time of Day: The average time of day that your followers are on Instagram
Followers – Day of Week: The days of week your followers are most active
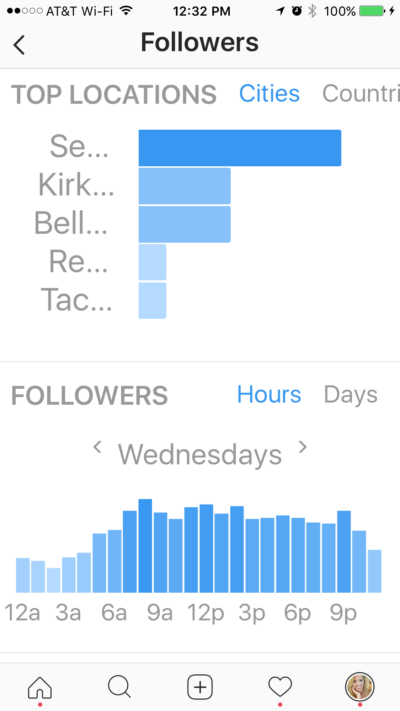
Since most of the followers are male, between the ages of 25-34 and live in Seattle, you may want to create content that appeals to that demographic and create a sponsored post targeted at that specific demographic. On Wednesdays the best time to post is 8:00 am. Post about an hour before this to reach the most people.
Post Performance Data:
Posts – If you tap on “posts” it will rank each post for the past year by the number of Impressions from highest to lowest. You can easily determine what your top posts are and look for trends.
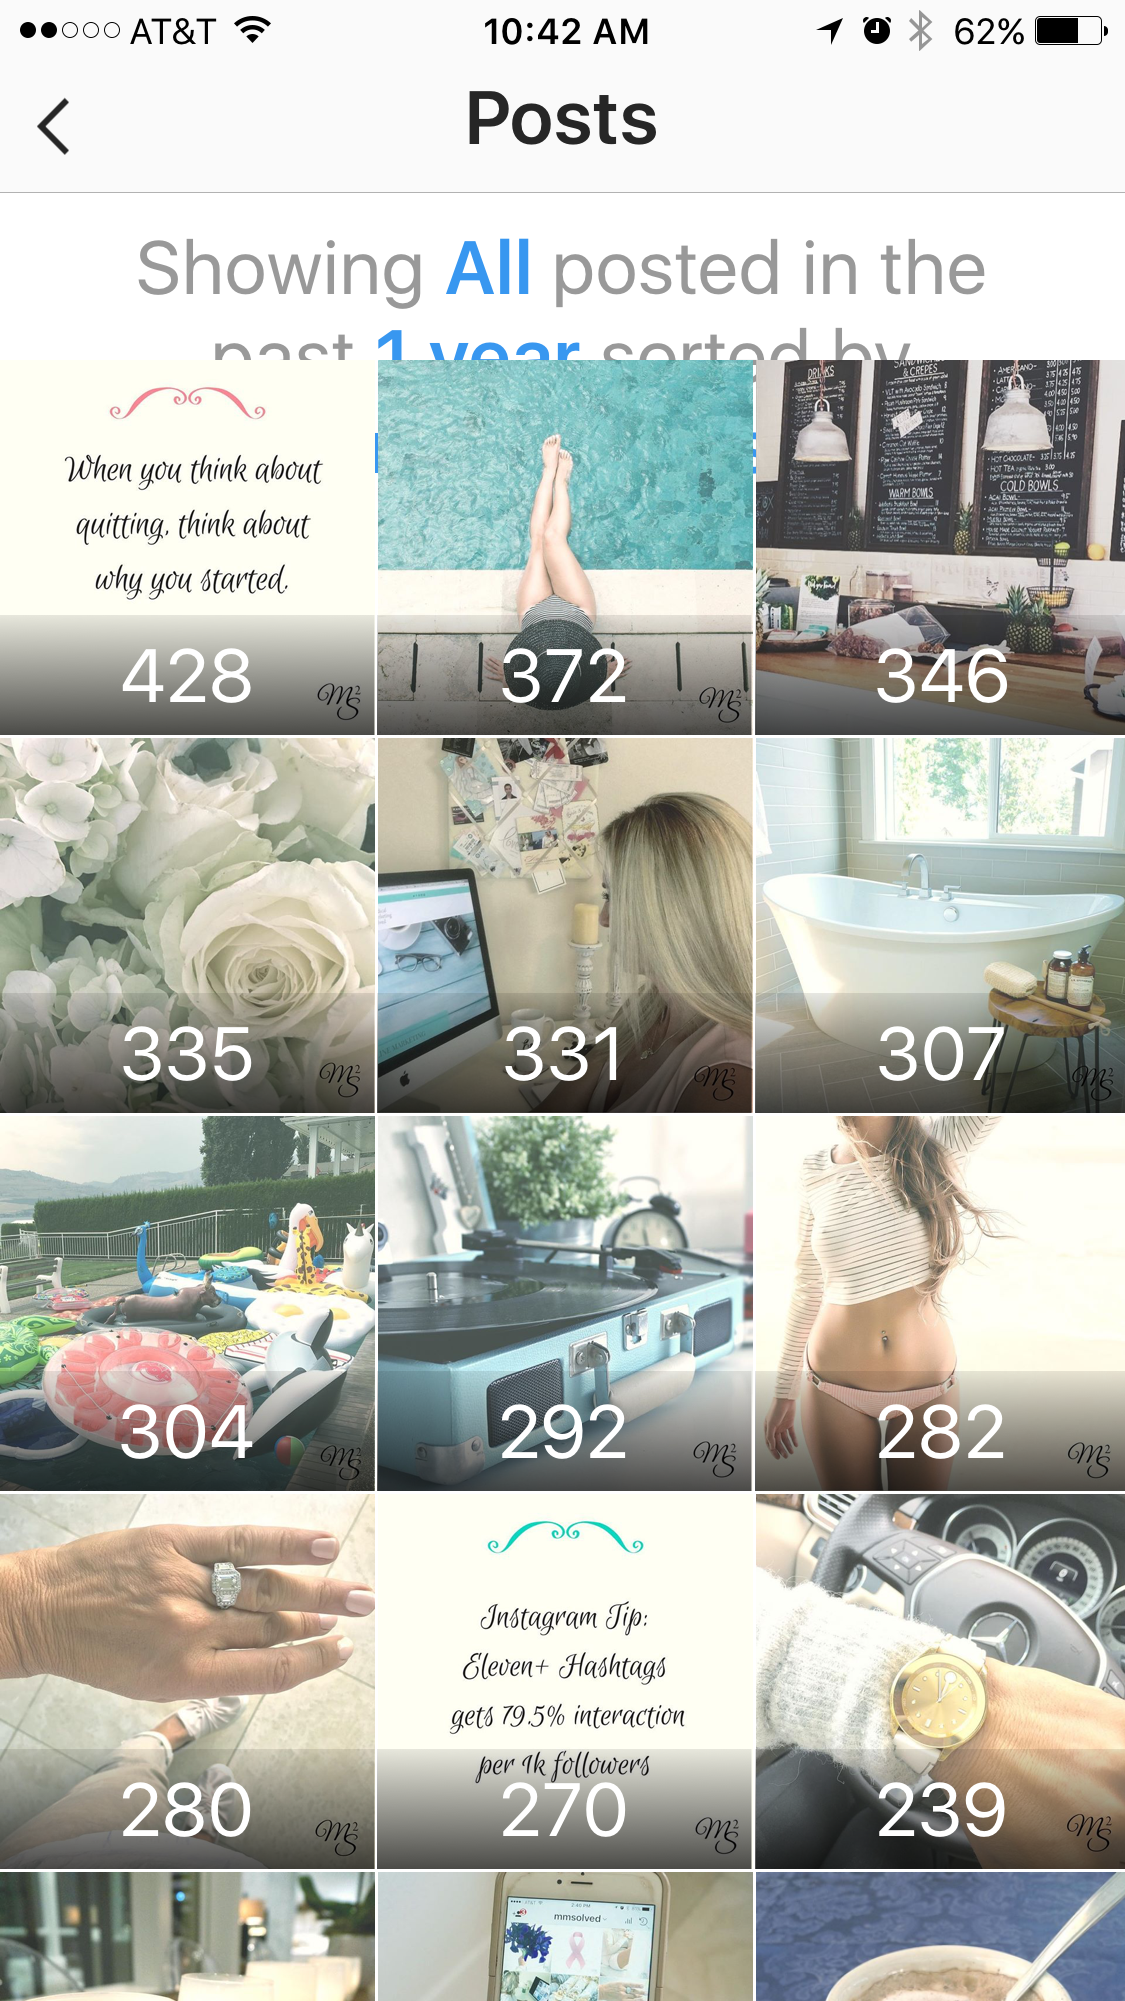
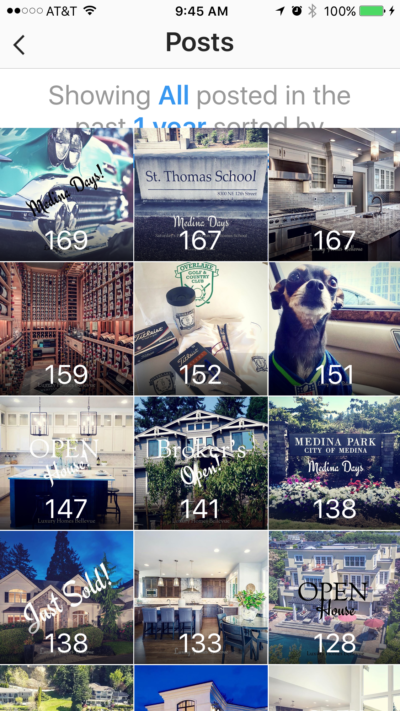
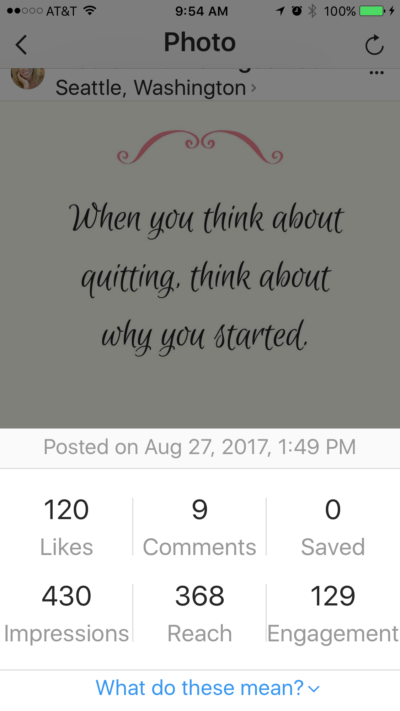
For additional insights of individual posts tap on the picture you’d like to view then tap on “Insights”. Likes, Comments, Saved, Impressions, Reach and Engagement are now displayed. Tip: For posting ideas check out my other blog post “20 Social media Post Ideas”.
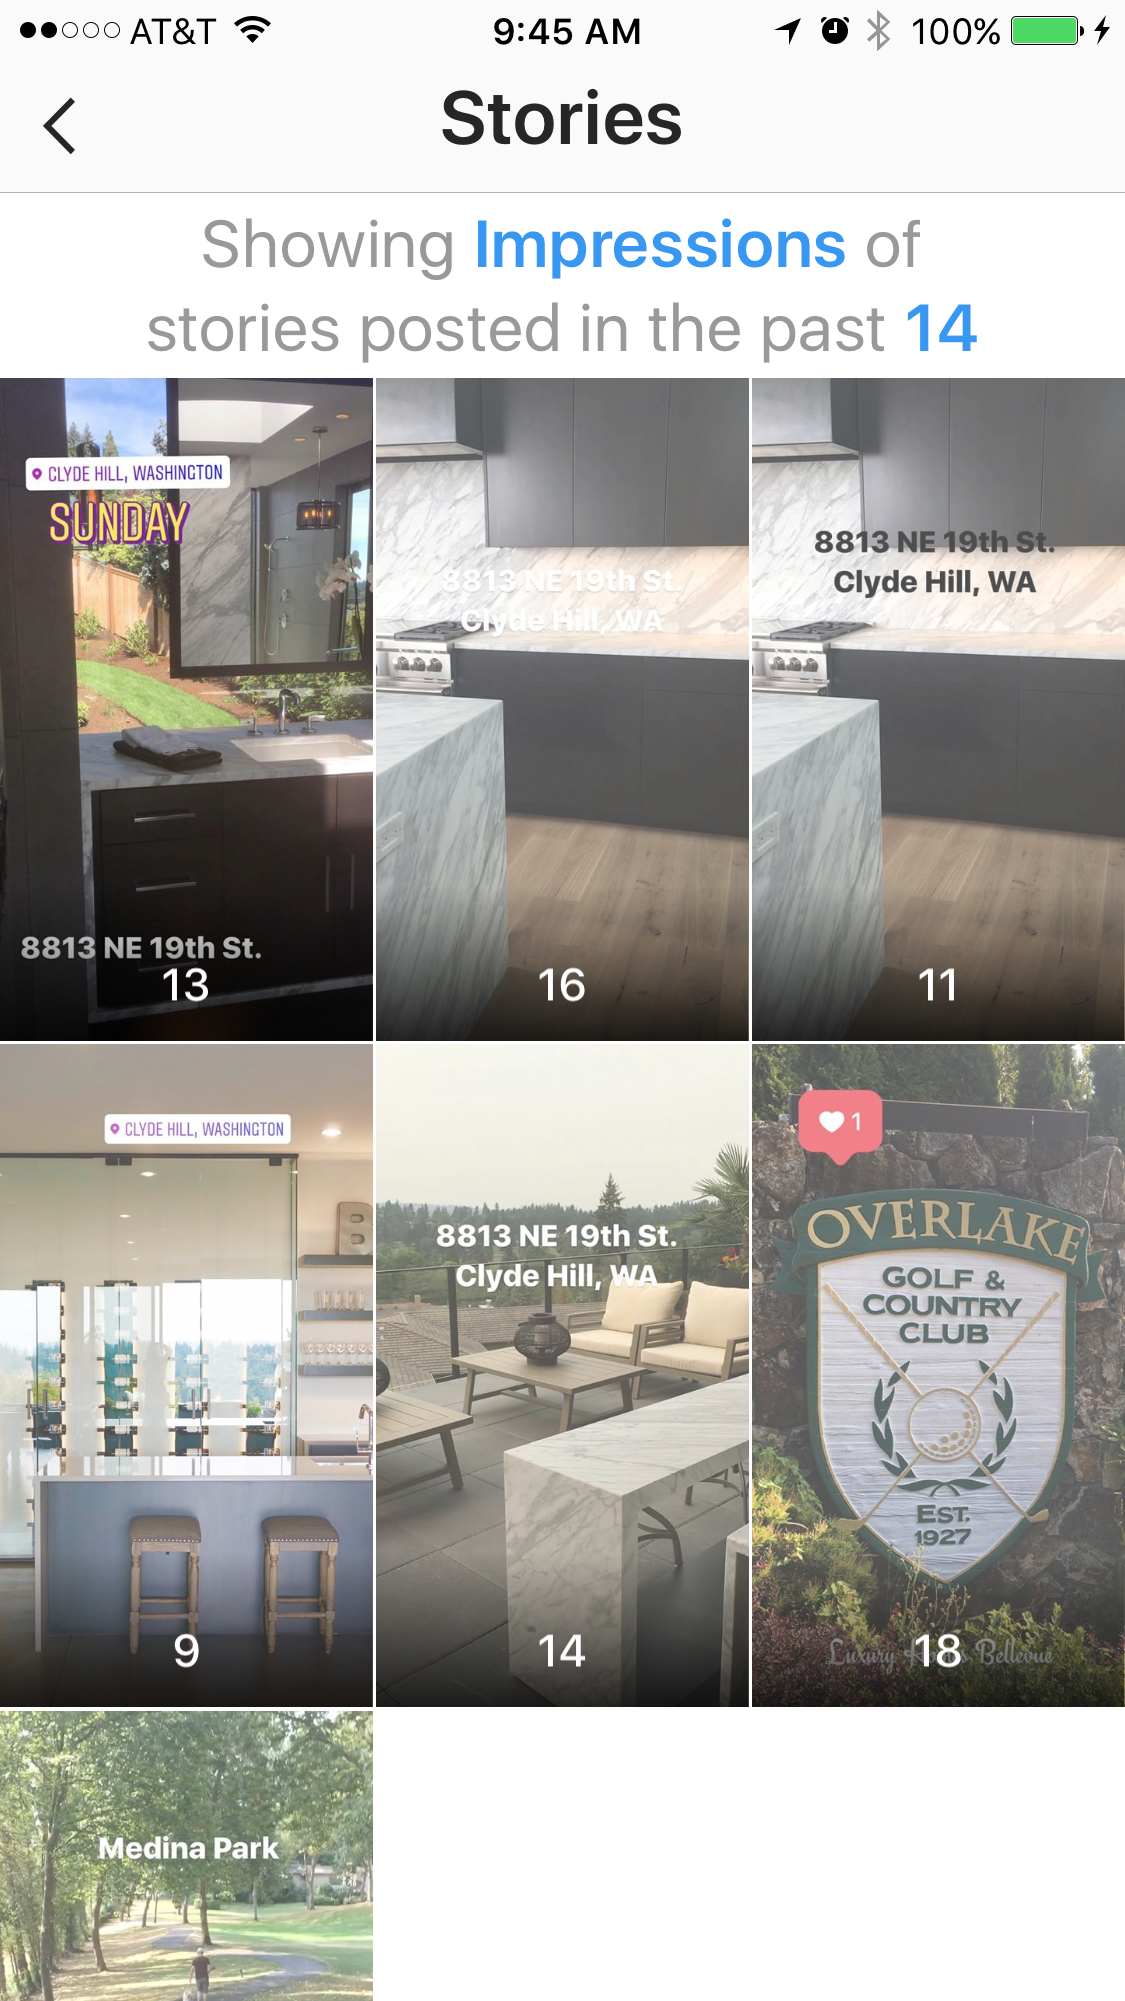
Stories – Tap on Stories for the number of Impressions for each of your stories in the past 14 days. Using this information you can determine what your top story is and create new stories that are similar. In this instance the most popular story is start of the University of WA’s football game. Given that most of the followers are male between the ages of 25-34 and live in Seattle this makes perfect sense.
 Promotions – Tap on Promotions for Reach (the number of unique accounts that saw your promotion.
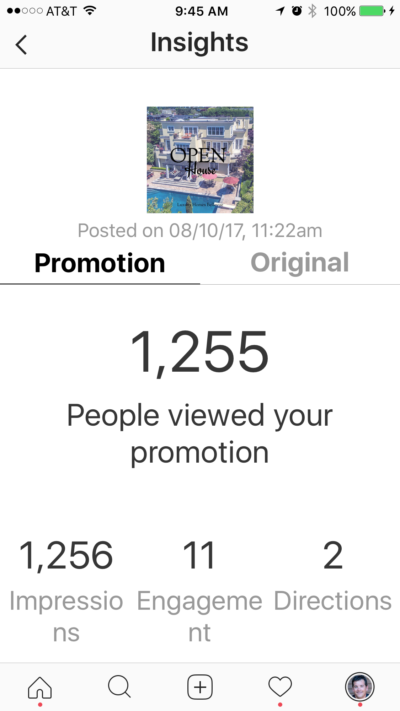
This post invited people to an open house that took place the following day and only ran for 1 day.
Tracking Instagram Analytics
Instagram Analytics or Insights are reported on a weekly basis. The data is only kept in your account for one week. Choose a day and time of week to track results. Record the data in a spreadsheet that can be converted into charts. Example below:
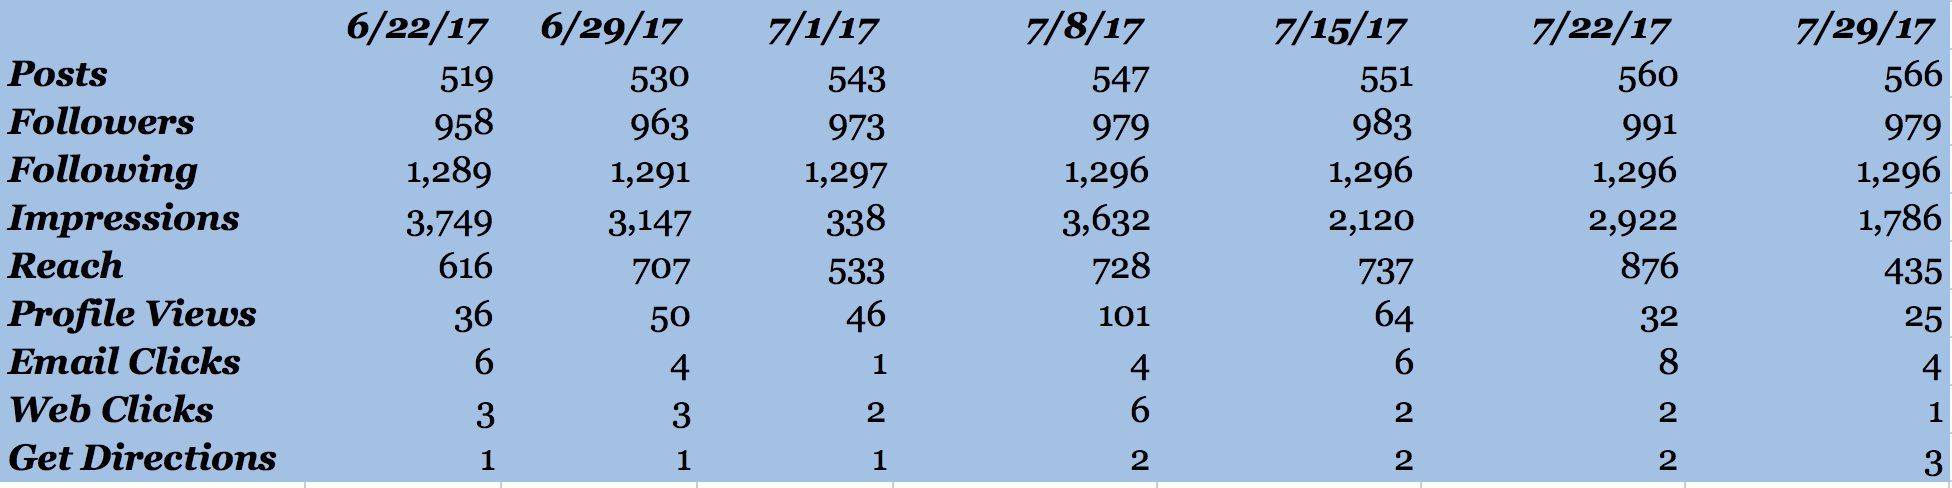
Using this data you can calculate your own analytics such as Average # of Impressions / Post.
With the data that is available whether obtained from Native Instagram Analytics or by using various tools, you can improve your Instagram’s performance. This post covered the basics and should meet most people’s needs. Use this data to create better content, reach the right people and determine the time of days of that your followers are most active and post during those times. You can also see if your Instagram posts are improving and getting more likes and followers over time.
Ways to Improve Your Instagram Using Insights<
- Change your posting times/days
- Improve content based on demographics
- Step-up your Instagram stories
- Improve your photos
- Use calls to action
- Choose better posts to promote